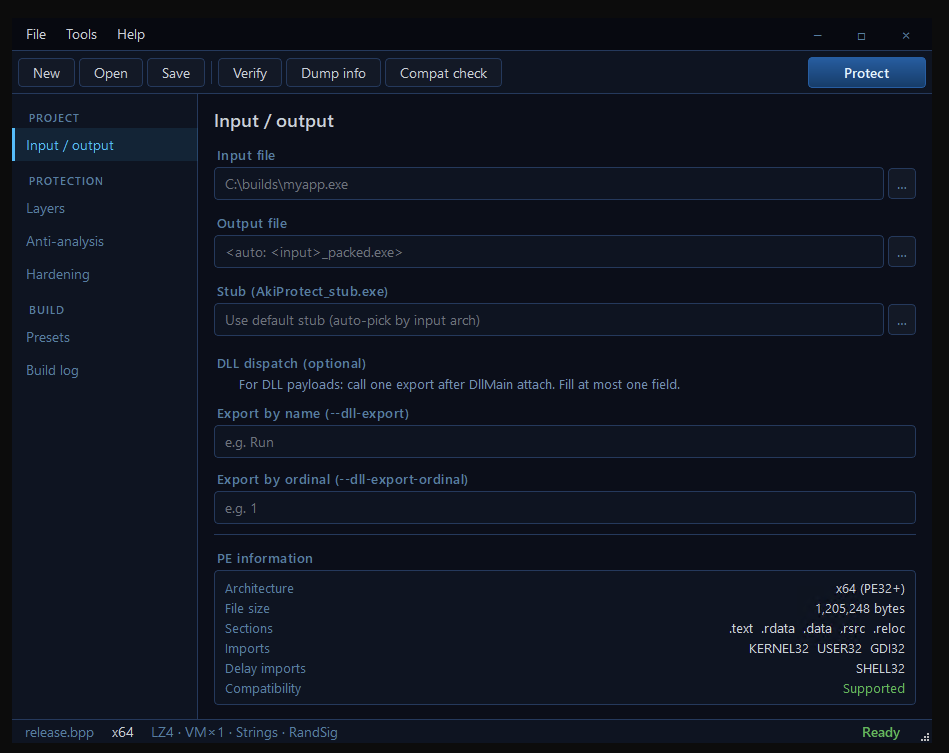
On this screen you choose the EXE or DLL that represents months of engineering — the build you don't want anyone copying, patching, or reselling. The output path auto-fills as <input>_packed.exe so a careless click never overwrites the original. Architecture detection (x86, x64, ARM64) is automatic; the runtime stub is matched to your binary without you having to think about it. The PE information panel at the bottom isn't decoration — it's a transparent audit of what's actually inside your file: the imports a reverse engineer would see, the sections that exist, the file size, the compatibility verdict. If a payload would be rejected, the verdict is red and the reason is one click away. No surprises during the build, no half-protected releases.
In this view
On the screenshot: a Windows EXE selected as input, auto-generated output path, the embedded stub auto-picked by architecture, optional DLL-export dispatch fields for library payloads, and a green Supported verdict in PE inspection — the green light to proceed.
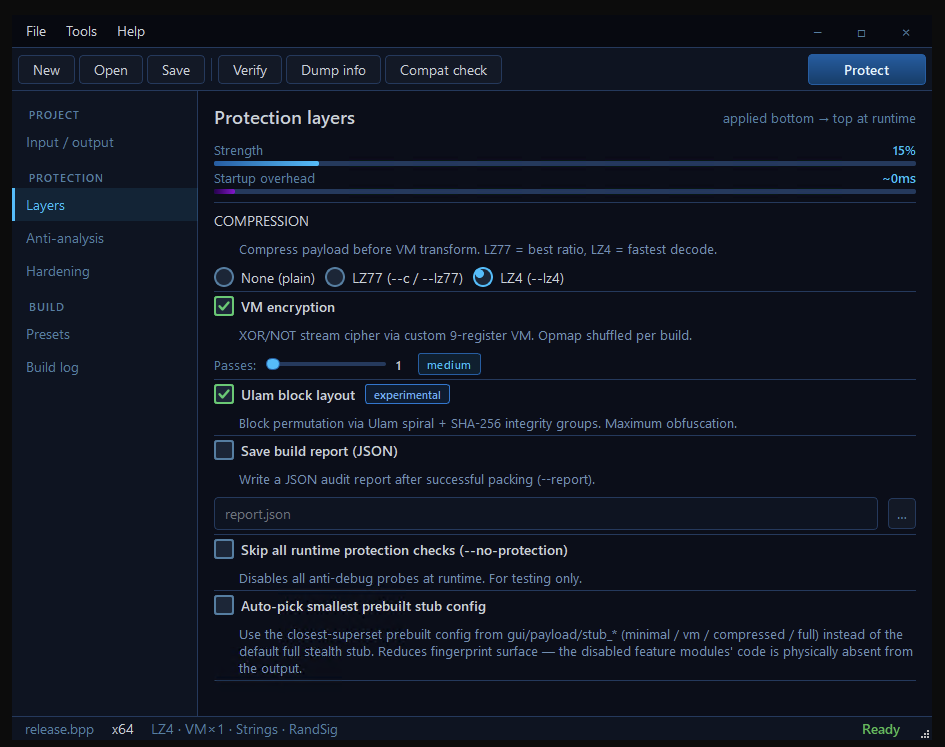
Compression shrinks the binary and reshuffles the bytes so signature scanners cannot match anything in your packed file against their databases. On top of that, the VM encryption replaces straight-line code with custom bytecode that runs on a 9-register virtual machine. The opcode mapping is randomized with the Windows CSPRNG on every single build — that is the killer feature. Two copies of the same binary, protected ten seconds apart, execute completely different bytecode. A cracker who spends a week defeating one copy gets nothing they can reuse against the next. Stack up to eight independent VM passes and the work scales linearly. Above all that, the Ulam block layout rearranges encrypted blocks using a deterministic spiral and binds them with SHA-256 integrity groups. Modify a single byte of the packed file and the runtime refuses to start. The Strength and Startup-overhead bars update live as you toggle — you see the trade-off as you make it, not after a failed deploy.
In this view
On the screenshot: live Strength meter at 15% with default Layers settings, compression set to LZ4, VM encryption enabled with a passes slider, the Ulam block layout activated with its experimental badge, and the option to save a JSON build report for audit trails.
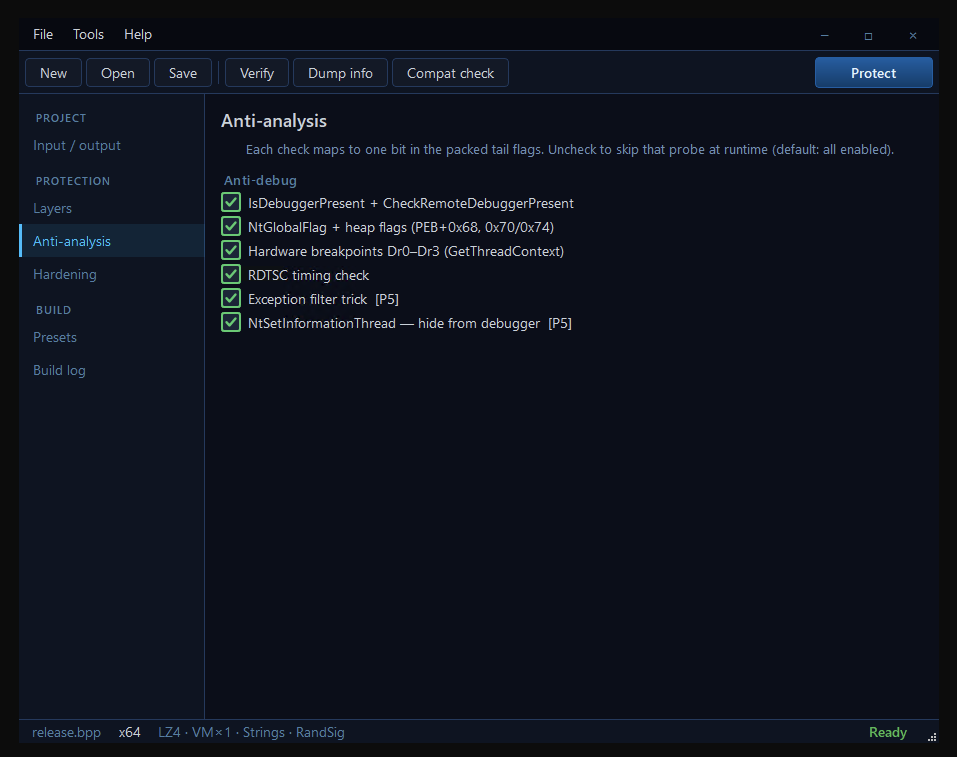
Six independent debugger-detection probes run before your code executes. They cover everything from a hobbyist attaching x64dbg to a professional reverser running IDA with custom plugins. The IsDebuggerPresent + CheckRemoteDebuggerPresent pair catches the casual attacker; reading NtGlobalFlag and heap flags directly from the PEB catches anyone who patches the API; Dr0-Dr3 inspection catches hardware breakpoints (which a reverse engineer prefers because they don't modify your code section); RDTSC timing detects single-stepping; the exception-filter trick measures behavioural differences between an attached and a detached process; NtSetInformationThread silently removes your thread from any debugger's event stream. Each probe maps to one bit in the packed file. If a probe triggers a false positive on a legitimate customer's machine — say, a profiler your QA team uses — you switch off that single check without disabling the rest. When any probe fires the runtime calls ExitProcess silently. No message, no error code, nothing for the attacker to grep. They sit there guessing which of the six just stopped them.
In this view
On the screenshot: all six anti-debug probes enabled by default, each individually toggleable. The headline explains the trade-off — uncheck a box and that specific probe is skipped at runtime, leaving the rest active.
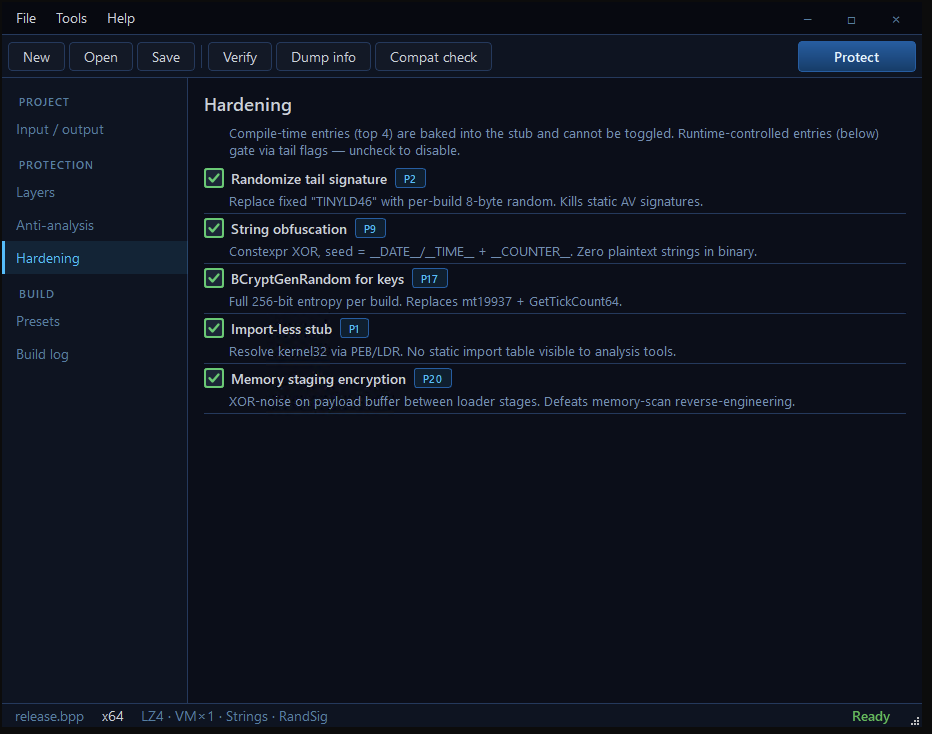
Five compile-time and runtime features harden the stub itself — the thin layer wrapped around your code that the OS loader actually executes first. Randomize tail signature replaces the historic fixed marker with random bytes from the Windows CSPRNG, so generic AV signatures that fingerprint the tail stop matching immediately. String obfuscation runs constexpr XOR over every string literal in the stub at compile time with a per-build seed; an attacker running strings on your file gets garbage. BCryptGenRandom delivers full 256-bit entropy for every key in every build — no shortcut to mt19937 + GetTickCount64. Import-less stub means the binary has an empty import directory: an attacker who opens your packed file in PE-bear or CFF Explorer cannot see which APIs your code touches, which makes guessing the protection strategy much harder. Memory staging encryption keeps the payload XOR-noised between every unpack stage, briefly yielding the thread while only ciphertext is in memory — memory scanners only ever catch encrypted bytes. All five are on by default in the Release preset. Disable only when you're debugging your own build.
In this view
On the screenshot: each hardening feature is labelled with the internal phase that introduced it (P1, P2, P9, P17, P20) so you can correlate the GUI exactly with the audit log produced by the builder.
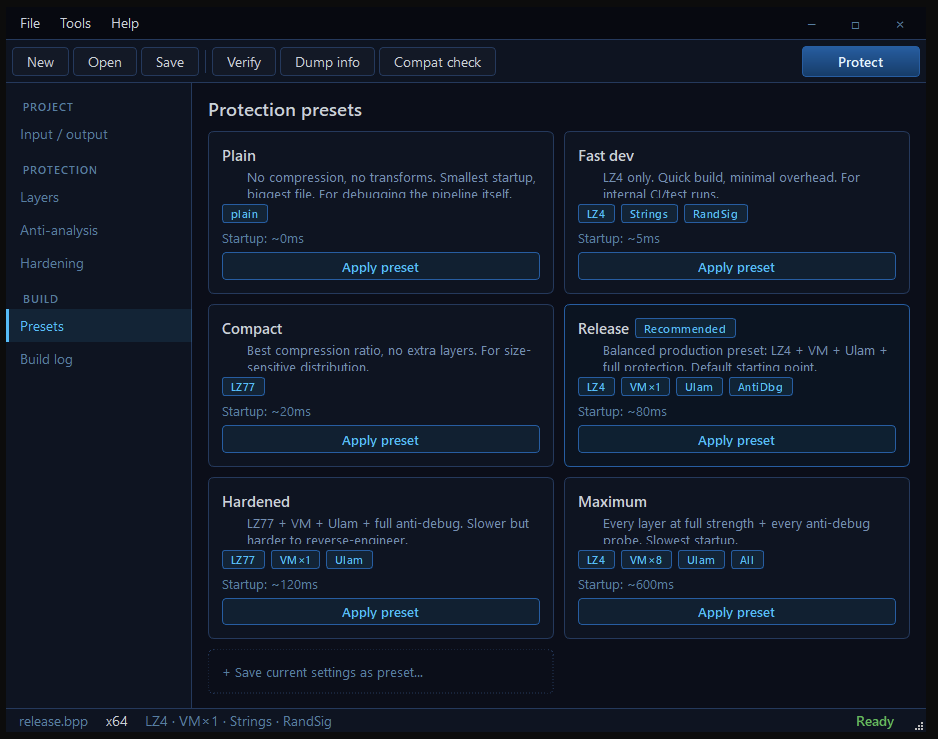
Release is the recommended default — LZ4 compression + one VM pass + Ulam layout + all anti-debug probes, about 80 milliseconds of startup overhead, balanced for shipping a real product. Hardened swaps LZ4 for LZ77, which packs tighter and produces a different bytecode shape: the resulting binary fingerprints differently from a Release build, so even an attacker who studied your previous version starts from scratch. Maximum stacks eight independent VM passes on top of Ulam and the full probe set; reserved for the algorithms your competitors have been trying to steal for years — the secret sauce that justifies the price of your product. Fast dev is LZ4 only, no defences, for the dozens of internal CI runs that exercise the build pipeline. Compact uses LZ77 for the tightest possible file size when bandwidth costs you money. Plain disables everything so you can confirm your payload runs cleanly through the loader before adding any encryption. Apply preset overwrites the Layers, Anti-debug and Hardening panels in one click — no walking through five screens to get a working config.
In this view
On the screenshot: six preset cards, each tagged with the layers they activate (LZ4, VM×1, Ulam, AntiDbg…) and an estimated startup cost (~0ms to ~600ms). The Release card carries a Recommended badge so a new user gets the right answer by default.
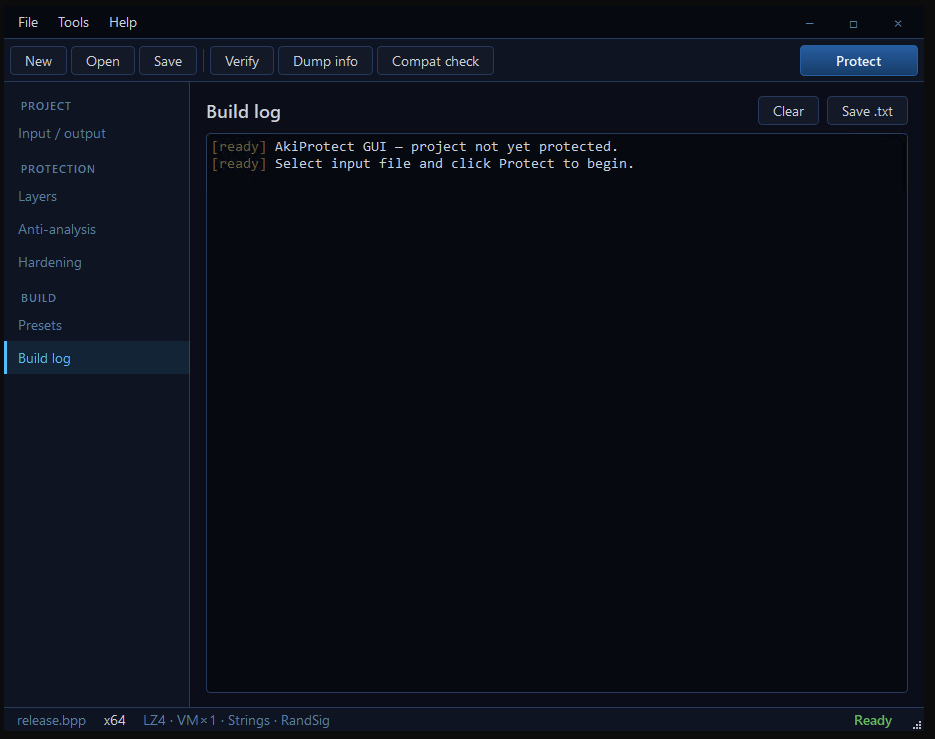
The build log shows the live colored output of the embedded AkiProtect builder, exactly as it would run on the command line. Stage announcements in cyan, success markers in green, warnings in amber, errors in red. If a protection bit fails to apply, the log tells you which one and why. If the loader rejects a structure in your PE — an unsupported overlay, a CLR section it cannot pack — the log names the exact stage and the exact reason. Click Verify and the offline verifier runs against an existing packed file and prints its findings into the same log. Click Dump info and the PE inspection lands here, structured and copy-pasteable. Save .txt captures the entire session into a plain text file your security team can attach to their compliance evidence; the JSON report from the Layers panel covers the machine-readable side. Every build is fully traceable.
In this view
On the screenshot: a fresh log just after the GUI started, with two ready-state messages confirming the builder is initialised and waiting. From here, every click produces visible, attributable output.